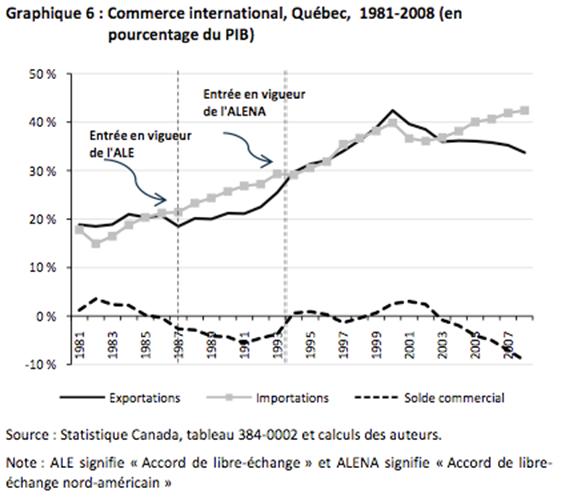
From several perspectives, Quebec can be viewed as an economy that trades extensively with the rest of the world. In 2008, Quebec’s international exports represented 33.7% of GDP. As a proportion of GDP, Quebec’s exports peaked in 2000, when 42.4% of domestic production was exported.
As Figure 6 reveals, Quebec has been running a negative balance of trade since 2003. This means that Quebec imports more goods and services than it exports.
2. Catching up spectacularly with the rest of Canada in terms of both employment and unemployment rates 
Historically, the unemployment rate has been higher in Quebec than in Ontario and Canada, as we see in Figure 11. The gap between the unemployment rates of Quebec and Ontario was particularly pronounced during the 1980s, when the rate was approximately four percentage points higher in the former than the in latter. This gap has vanished in the meantime, however, following a continuous period of decrease starting at the end of 1999. For the first time since 1976, this gap even became negative in January of 2009 when Quebec’s unemployment rate fell below that of Ontario, though this does not appear in the annualized data of Figure 11.
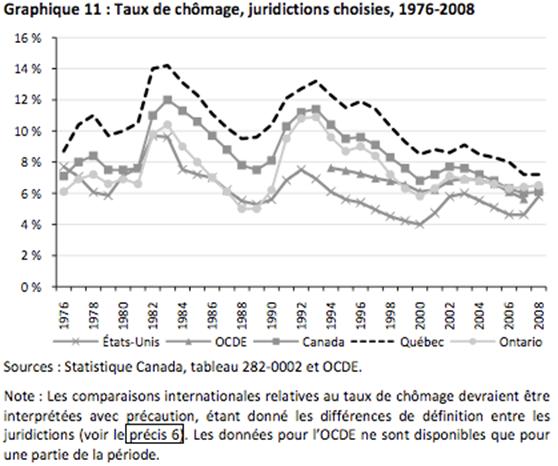
Quebec’s unemployment rate is also higher than that of other reference jurisdictions. While the difference with the Canadian unemployment rate has remained relatively stable over time, fluctuating between 1.5 and 2.5 percentage points, it has tended to shrink relative to those of the United States and the OECD Member States. The gap with the United States began to close during the recovery that followed the recession of the early 1990s. Starting in 1996, the gap between the Quebec and U.S. unemployment rates has declined steadily, dropping from 6.5 percentage points in 1996 to 1.4 in 2008.
As we see from Table 7 , transfers and taxes reduce inequalities. This reduction is greater in Quebec than in Ontario and in Canada, both for families (. 0,143 versus . 0,109 and . 0,114) and for individuals (. 0,207 versus . 0,172 and . 0,176). The table also illustrates that transfers contribute twice as much to reducing inequalities as taxes.
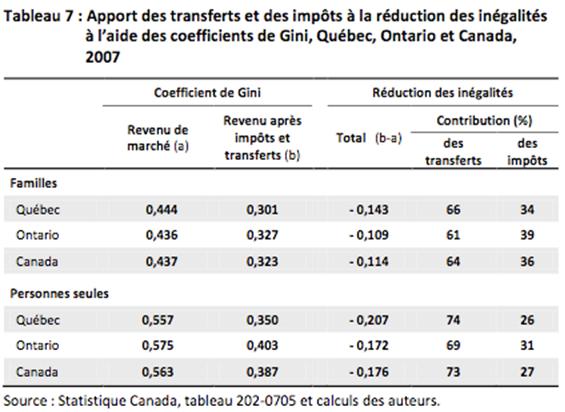
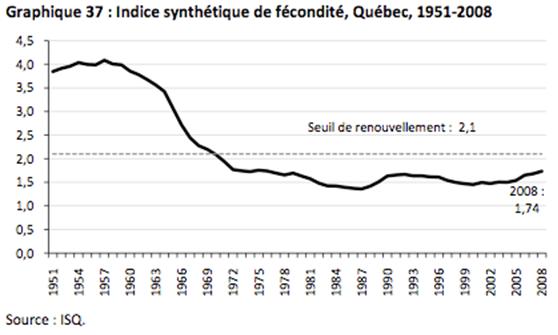
Figure 37 reveals a decline in the total fertility rate in Quebec since the 1960s. From approximately 3.9 children per woman between 1951 and 1962, it subsequently fell into a steady decline until the mid-1980s, when it stabilized at near 1.5 children per woman. Though it has crept up to 1.7 in recent years, this rate remains below the 2.1 threshold required to ensure natural renewal of the population.
In 1970, Quebec’s total balance of migration was negative by nearly 45 000 individuals. It reached a peak at plus 35 000 in 2004. Since then, Quebec has welcomed an annual average of 27 300 more individuals than have left.
While Quebec’s international balance of migration was persistently positive between 1971 and 2008, its corresponding interprovincial balance was negative during this period. In each of these years, Quebec lost residents to the other provinces of Canada. The greatest drain on the population of Quebec occurred in 1970 and 1977, when net departures for other provinces amounted to 45 000 and 30 000 persons, respectively.
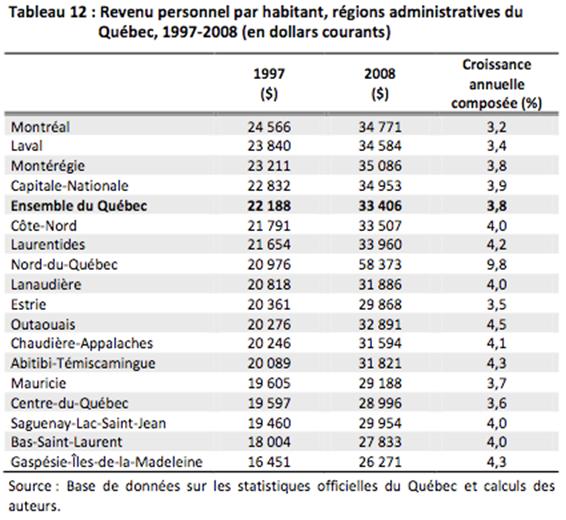
As we see in Table 12 , per capita personal income in 2008 was highest in the Nord-du-Québec region, at over $58 000. From 1997 to 2008, per capita income rose considerably in all administrative regions of Quebec. As a rule, in those regions in which per capita personal income was below the Quebec average in 1997 it remained there in 2008. This is particularly the case in the regions Gaspésie-Îles-de-la-Madeleine ($26 271 in 2008), Bas-Saint-Laurent ($27 833), Mauricie ($29 188) and Saguenay-Lac-Saint-Jean ($29 954). The regions Laurentides ($33 960), Nord-du-Québec ($58 373) and Côte-Nord ($33 507) are exceptions to the rule.
7. Government spending that, despite a strong upward trend in healthcare spending, appears compatible with our collective wealth
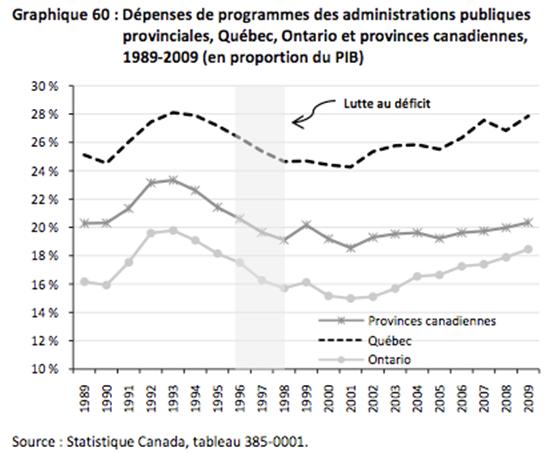
Figure 60 also reveals that program spending in Quebec has fluctuated between 24% and 28% of GDP in the past 20 years. Between its high in 1993 and low in 2001, we find the period of fiscal restraint that followed the socio-economic summit of 1996 and led to the zero deficit of 1998—the impact of which is clearly seen. Finally, in recent years the expenditures of the government of Quebec have risen more rapidly than economic growth—a phenomenon we also observe in the other provinces, though to a lesser extent.
In Quebec, Ontario, and the interprovincial average, government spending has risen constantly since 1989 when measured in constant dollars per capita, except during the years of fiscal restraint between 1996 to 1998. In 1998, following most of the cutbacks, the provinces of Canada had collectively reduced their per capita expenditures to 1991 levels. This was also the case in Ontario, though Quebec had brought per capita program spending back to its 1992 level.
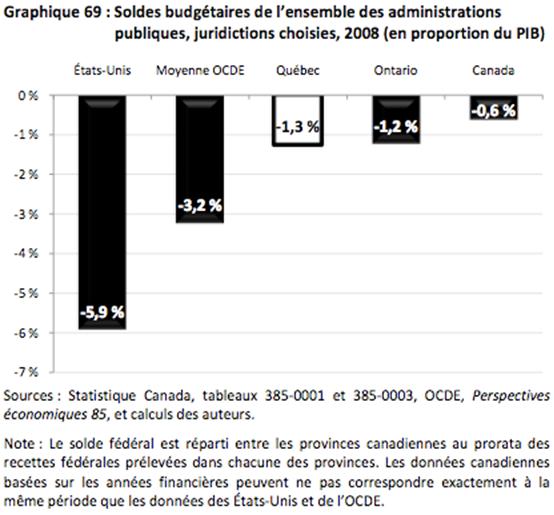
The fiscal restraint that allowed governments to balance their books is an asset that Canada brings to the international scene. Figure 69 , in which the budgetary balances of all levels of government are consolidated, clearly reveals how far the United States and the average of the OECD member states are from balanced budgets in 2008.